
Real-Time Value Comparison Animation
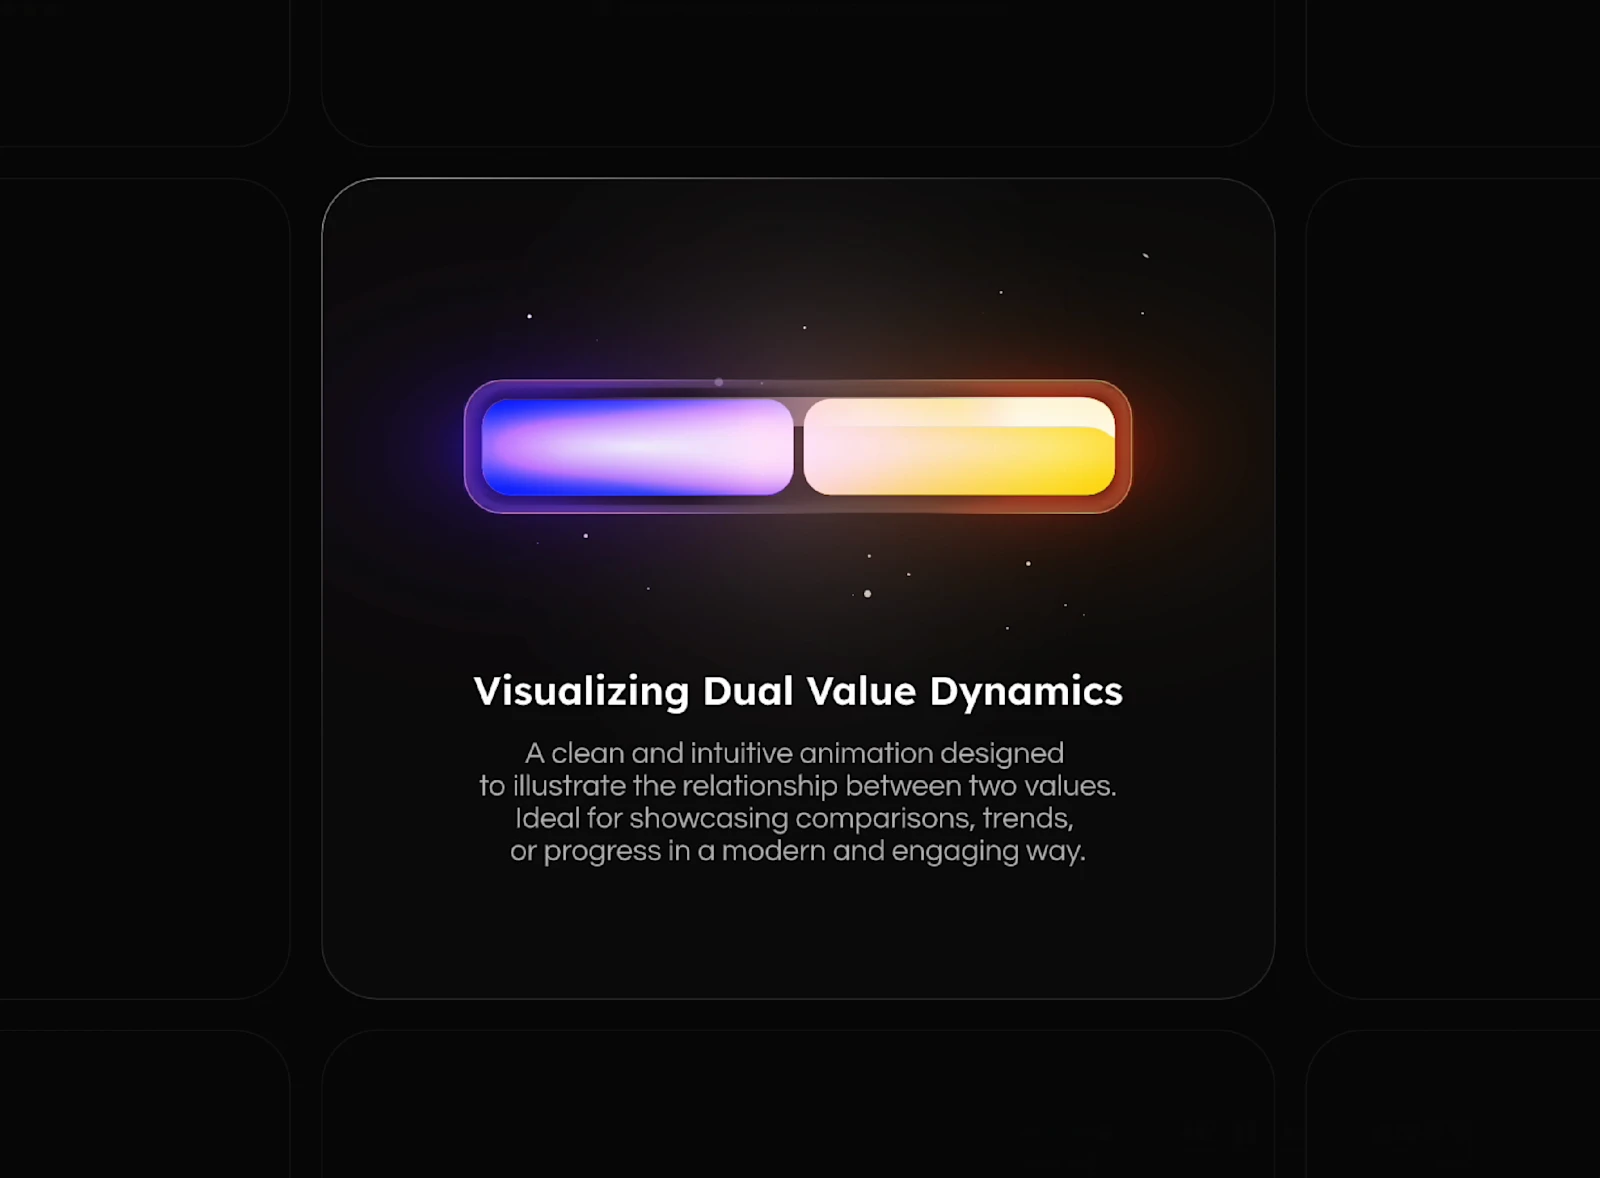
Dynamic value comparison animation built in Rive. Perfect for dashboards or analytics. Smooth, real-time motion that brings data to life.
- Role
- Motion Designer, Rive Animator
- Tools
- Rive
- Published
- Jun 2025
Animated value comparison built in Rive
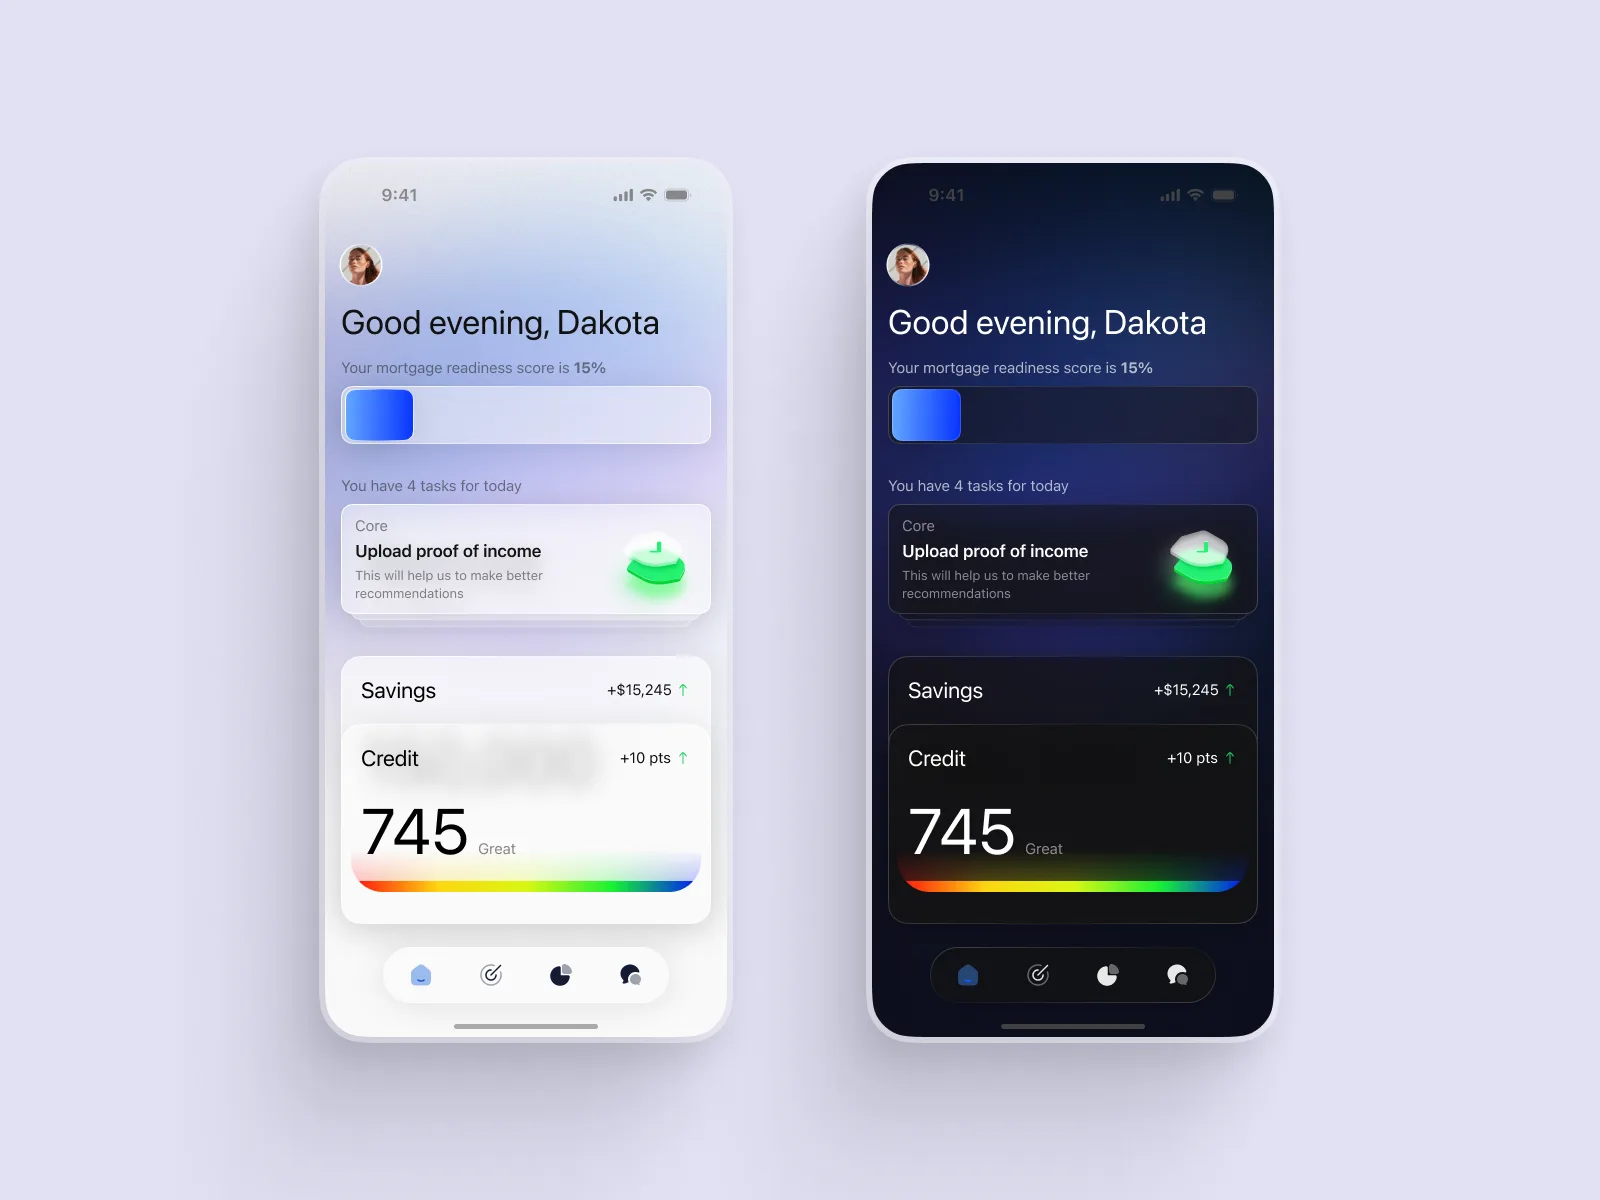
This animation showcases a dynamic comparison between two values, visually representing their proportions in real-time. As one color gradually overtakes the other, it highlights the shifting balance between data points, an engaging way to reflect trends, progress, or competition.
The motion is smooth and continuous, designed to feel intuitive and responsive without overwhelming the interface. It’s ideal for data-rich environments like analytics dashboards, KPI modules, or any UI where quick visual interpretation is key.
Crafted in Rive, this animation leverages real-time tooling for easy iteration, curve control, and seamless playback. It’s lightweight, scalable, and easy to integrate into both web and mobile interfaces, bringing data to life with subtle yet expressive motion.